6..2.1 Understand the concept of perimeter (2)
6..2.2 Understand the concept of area (1)
Each of this week's tasks involves a fairly simple shape: the rectangle. However, the rectangles are dynamic: they can change in a variety of ways, and we consider what happens to the perimeter as they do. We also start to look at area.
It is unlikely that students will use such ideas to the full, but some of the ideas might emerge if students adopt an empirical approach that is systematic.
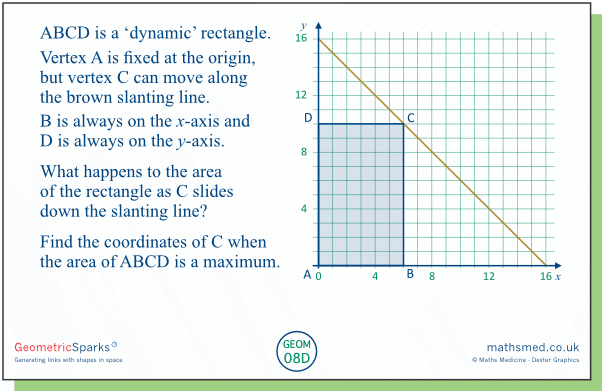
Tuesday: Here we look at the same scenario but this time consider the area of the rectangle rather than its perimeter. We discovered from Monday's task that the perimeter steadily decreases as point C moves down the slanting line. The rectangle's area behaves differently: initially it increases before decreasing again, so at some point it reaches a maximum.
It is unlikely that students will adopt anything other than an empirical approach for finding the maximum area. This happens when C has coordinates (4, 8), which gives an area of 32 square units. An ordered table of values can be useful here, to arrive at this maximum and to reveal that the values of the area are symmetrical about x = 4.
Should we be surprised that this maximum value for the area occurs at this halfway point in C's journey? Not really (though I was at first...).
Wednesday: This is similar to Monday's task, but this time the slanting line is at 45˚ to the axes. (It is symmetrical about y=x; its equation is x+y=16 rather than 2x+y=16).
It turns out that the perimeter is constant this time, as C slides down the slanting line. This might come as a surprise - at first!
The maximum area occurs at the midpoint of C's journey again, which should come as a no surprise this time - where else could it be, given that we have a 'symmetrical' line (x+y=16) and a symmetrical area relation (area = xy)? This helps to explain why Tuesday's maximum also occurred at the midpoint of C's journey. We can think of Tuesday's diagram as a vertically stretched version of today's, with a scale factor of ×2. This means that for a given value of the x-coordinate of C, the area of the rectangle in Tuesday's diagram will be twice the area of the corresponding rectangle in today's diagram. And so the maximum area will occur for the same value of x, namely x = 4.
Friday: This is quite a rich task but students might need help making sense of the rather subtle
definition of the rectangle. It is important for students to try to
visualise the rectangle as vertex C moves along the x-axis -
you might want to ask them to describe what they see.
[An animation of the rectangle can be found here.]

The rectangle's area approaches 0 as the x-coordinate of point C approaches 0 and 16. Between those values, it might be thought that the rectangle would have a maximum area when it is a square. (It is a nice challenge for students to find the coordinates of C for which the rectangle is a square.) However, it turns out that the maximal shape is a half-square, as with the classic Sheep Pen problem (where a farmer constructs a rectangular pen using a given length of fencing and part of a wall). This happens when C is at (8, 0).
An illuminating take on this is to reflect the diagram in the brown line (x + y = 16). We then get a double-rectangle enclosed in a 16-by-16 square. What can we say about its perimeter? When is the area a maximum for such a rectangle?
It is also interesting to explore what happens if C is allowed to move beyond the origin to the left, or beyond (16, 0) to the right. In these positions the direction of AD and BC switches, and it makes sense to regard their lengths as negative now - for example, doing so means that the relation 'perimeter = 16 + AD diagonal units' still holds.


